BOMBAY STOCK EXCHANGE -
- BSE SENSEX
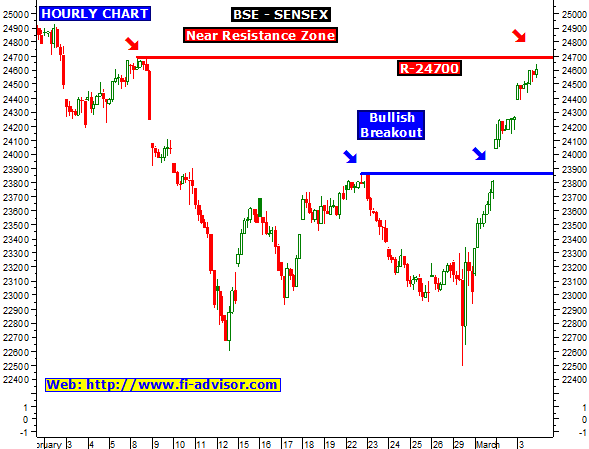
BSE Sensex hourly chart indicates that it is on bull move after closing above its previous intraday top.
Technical chart indicates that it is now finding strong intraday trend line resistance at its previous top, once it holds above then further bulls action can be seen during trading hours.
If it fails to hold above then weakness can be seen during trading hours.


